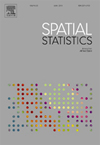
Spatial StatisticsSCIE
國際簡稱:SPAT STAT-NETH 參考譯名:空間統計
- 基本信息:
- ISSN:2211-6753
- 是否OA:未開放
- 是否預警:否
- TOP期刊:是
- 出版信息:
- 出版地區:ENGLAND
- 出版商:Elsevier BV
- 出版語言:English
- 出版周期:4 issues/year
- 出版年份:2012
- 研究方向:GEOSCIENCES, MULTIDISCIPLINARY-MATHEMATICS, INTERDISCIPLINARY APPLICATIONS
- 評價信息:
- 影響因子:2.1
- H-index:17
- CiteScore指數:4
- SJR指數:0.805
- SNIP指數:1.127
- 發文數據:
- Gold OA文章占比:31.87%
- 研究類文章占比:100.00%
- 年發文量:68
- 自引率:0.2173...
- 開源占比:0.144
- 出版撤稿占比:
- 出版國人文章占比:0.04
- OA被引用占比:0.0740...
英文簡介Spatial Statistics期刊介紹
Spatial Statistics publishes articles on the theory and application of spatial and spatio-temporal statistics. It favours manuscripts that present theory generated by new applications, or in which new theory is applied to an important practical case. A purely theoretical study will only rarely be accepted. Pure case studies without methodological development are not acceptable for publication.
Spatial statistics concerns the quantitative analysis of spatial and spatio-temporal data, including their statistical dependencies, accuracy and uncertainties. Methodology for spatial statistics is typically found in probability theory, stochastic modelling and mathematical statistics as well as in information science. Spatial statistics is used in mapping, assessing spatial data quality, sampling design optimisation, modelling of dependence structures, and drawing of valid inference from a limited set of spatio-temporal data.
期刊簡介Spatial Statistics期刊介紹
《Spatial Statistics》自2012出版以來,是一本數學優秀雜志。致力于發表原創科學研究結果,并為數學各個領域的原創研究提供一個展示平臺,以促進數學領域的的進步。該刊鼓勵先進的、清晰的闡述,從廣泛的視角提供當前感興趣的研究主題的新見解,或審查多年來某個重要領域的所有重要發展。該期刊特色在于及時報道數學領域的最新進展和新發現新突破等。該刊近一年未被列入預警期刊名單,目前已被權威數據庫SCIE收錄,得到了廣泛的認可。
該期刊投稿重要關注點:
Cite Score數據(2024年最新版)Spatial Statistics Cite Score數據
- CiteScore:4
- SJR:0.805
- SNIP:1.127
| 學科類別 | 分區 | 排名 | 百分位 |
| 大類:Mathematics 小類:Statistics and Probability | Q1 | 47 / 278 |
83% |
| 大類:Mathematics 小類:Computers in Earth Sciences | Q2 | 30 / 73 |
59% |
| 大類:Mathematics 小類:Management, Monitoring, Policy and Law | Q2 | 175 / 399 |
56% |
CiteScore 是由Elsevier(愛思唯爾)推出的另一種評價期刊影響力的文獻計量指標。反映出一家期刊近期發表論文的年篇均引用次數。CiteScore以Scopus數據庫中收集的引文為基礎,針對的是前四年發表的論文的引文。CiteScore的意義在于,它可以為學術界提供一種新的、更全面、更客觀地評價期刊影響力的方法,而不僅僅是通過影響因子(IF)這一單一指標來評價。
中科院SCI分區Spatial Statistics 中科院分區
| 大類學科 | 分區 | 小類學科 | 分區 |
| 數學 | 2區 | MATHEMATICS, INTERDISCIPLINARY APPLICATIONS 數學跨學科應用 STATISTICS & PROBABILITY 統計學與概率論 GEOSCIENCES, MULTIDISCIPLINARY 地球科學:綜合 REMOTE SENSING 遙感 | 2區 2區 3區 3區 |
中科院分區表 是以客觀數據為基礎,運用科學計量學方法對國際、國內學術期刊依據影響力進行等級劃分的期刊評價標準。它為我國科研、教育機構的管理人員、科研工作者提供了一份評價國際學術期刊影響力的參考數據,得到了全國各地高校、科研機構的廣泛認可。
中科院分區表 將所有期刊按照一定指標劃分為1區、2區、3區、4區四個層次,類似于“優、良、及格”等。最開始,這個分區只是為了方便圖書管理及圖書情報領域的研究和期刊評估。之后中科院分區逐步發展成為了一種評價學術期刊質量的重要工具。
JCR分區Spatial Statistics JCR分區
| 按JIF指標學科分區 | 收錄子集 | 分區 | 排名 | 百分位 |
| 學科:GEOSCIENCES, MULTIDISCIPLINARY | SCIE | Q3 | 127 / 253 |
50% |
| 學科:MATHEMATICS, INTERDISCIPLINARY APPLICATIONS | SCIE | Q2 | 43 / 135 |
68.5% |
| 學科:REMOTE SENSING | SCIE | Q3 | 33 / 62 |
47.6% |
| 學科:STATISTICS & PROBABILITY | SCIE | Q1 | 26 / 168 |
84.8% |
| 按JCI指標學科分區 | 收錄子集 | 分區 | 排名 | 百分位 |
| 學科:GEOSCIENCES, MULTIDISCIPLINARY | SCIE | Q2 | 74 / 253 |
70.95% |
| 學科:MATHEMATICS, INTERDISCIPLINARY APPLICATIONS | SCIE | Q2 | 36 / 135 |
73.7% |
| 學科:REMOTE SENSING | SCIE | Q2 | 23 / 62 |
63.71% |
| 學科:STATISTICS & PROBABILITY | SCIE | Q1 | 26 / 168 |
84.82% |
JCR分區的優勢在于它可以幫助讀者對學術文獻質量進行評估。不同學科的文章引用量可能存在較大的差異,此時單獨依靠影響因子(IF)評價期刊的質量可能是存在一定問題的。因此,JCR將期刊按照學科門類和影響因子分為不同的分區,這樣讀者可以根據自己的研究領域和需求選擇合適的期刊。
發文數據
- 國家/地區數量
- USA48
- England18
- Italy17
- France15
- Spain14
- GERMANY (FED REP GER)11
- Netherlands11
- CHINA MAINLAND9
- Canada9
- Brazil8
本刊中國學者近年發表論文
-
1、Space–time covariance functions based on linear response theory and the turning bands method
Author: Dionissios T. Hristopulos, Ivi C. Tsantili
Journal: Spatial Statistics, 2017, Vol.22, 321-337, DOI:10.1016/j.spasta.2017.07.001
-
2、Regional economy and development: A viewpoint and application of spatial statistics
Author: Yong Ge, Xi Zhao
Journal: Spatial Statistics, 2017, Vol.21, 337-338, DOI:10.1016/j.spasta.2017.04.004
-
3、A likelihood-based spatial statistical transformation model (LBSSTM) of regional economic development using DMSP/OLS time-series nighttime light imagery
Author: Chang Li, Guie Li, Yujia Zhu, Yong Ge, Hsiang-te Kung, Yijin Wu
Journal: Spatial Statistics, 2017, Vol.21, 421-439, DOI:10.1016/j.spasta.2017.03.004
-
4、Space–time variability analysis of poverty alleviation performance in China’s poverty-stricken areas
Author: Yong Ge, Yue Yuan, Shan Hu, Zhoupeng Ren, Yijin Wu
Journal: Spatial Statistics, 2017, Vol.21, 460-474, DOI:10.1016/j.spasta.2017.02.010
-
5、Understanding the inconsistent relationships between socioeconomic factors and poverty incidence across contiguous poverty-stricken regions in China: Multilevel modelling
Author: Zhoupeng Ren, Yong Ge, Jinfeng Wang, Jingyao Mao, Qi Zhang
Journal: Spatial Statistics, 2017, Vol.21, 406-420, DOI:10.1016/j.spasta.2017.02.009
-
6、An evaluation of China’s urban agglomeration development from the spatial perspective
Author: Xiao-lu Gao, Ze-ning Xu, Fang-qu Niu, Ying Long
Journal: Spatial Statistics, 2017, Vol.21, 475-491, DOI:10.1016/j.spasta.2017.02.008
-
7、Effects of different sampling densities on geographically weighted regression kriging for predicting soil organic carbon
Author: Huichun Ye, Wenjiang Huang, Shanyu Huang, Yuanfang Huang, Shiwen Zhang, Yingying Dong, Pengfei Chen
Journal: Spatial Statistics, 2017, Vol.20, 76-91, DOI:10.1016/j.spasta.2017.02.001
-
8、Utilizing spatial association analysis to determine the number of multiple grids for multiple-point statistics
Author: Hexiang Bai, Yong Ge, Gregoire Mariethoz
Journal: Spatial Statistics, 2016, Vol.17, 83-104, DOI:10.1016/j.spasta.2016.06.003
投稿常見問題
-
請問這本期刊屬于什么級別呢?可用于職稱評定嗎?
一般刊物只分省級、部級、核心,期刊本身是沒有幾類劃分的,具體是幾類或者幾級,您可以對照單位的分類文件確認一下。Spatial Statistics雜志是由Elsevier BV出版的一本SCIE,可用于職稱評定。
-
你們能夠提供哪些核心期刊的咨詢服務?
大多數核心期刊我們都是可以提供咨詢服務的。目前核心期刊主要分為以下幾類:1.國內核心:按照權威度排序,社科類:南大核心>南大擴展>北大核心>科技核心 按照權威度排序。工科類:CSCD C庫>CSCD E庫(相當于CSCD擴展)>北大核心>科技核心。2.國外核心(全英文):按照權威度排序為:SSCI=SCI>EI>ISTP=CPCI。
-
想快速發表,可以加急嗎?
為了確保您的職稱評定順利進行,我們建議提前半年到一年開始準備,這樣能夠保證有充足的時間來處理所有相關事宜。如果客戶需要加急服務,我們會與雜志社進行溝通,以確定是否可以提供加急服務。請注意,如果確認可以加急,可能會收取一定的加急費用。
-
你們提供的服務可以確保稿件被發表嗎?
期刊編輯會綜合考慮多個因素,如發表范圍、學術價值和原創性等,對稿件進行綜合評估。盡管任何機構均無法保證每篇稿件都會被發表,但我們可以用專業知識和豐富經驗,協助您理解并遵循期刊的發表要求,從而提高您的稿件被發表的機率。
-
請問期刊發表的費用如何?
期刊發表的費用因期刊不同而異。根據您的需求,我們會為您推薦性價比最高的期刊,并提供專業的期刊供您選擇。一般來說,只要符合職稱要求,大多數作者都會選擇性價比最高的期刊作為意向期刊進行重點咨詢。我們會為您提供詳細的期刊信息和費用說明,以確保您能夠做出明智的選擇。
-
如果稿件被拒,未能成功發表,費用是否可以退還?
一般來說,我們推薦的期刊和您的專業方向、文章情況都是匹配的,極少出現稿件被拒的情況。如果稿件被拒,期刊編輯會提供詳細的拒稿信和建議,以幫助您了解拒稿原因并改進您的稿件。關于退款政策,具體情況可能因期刊不同而異,請您咨詢我們的工作人員以獲取詳細信息。
相關期刊推薦
-
Journal De L Ecole Polytechnique-mathematiques
中科院 2區 JCR Q1
大類:數學
-
Journal Of Partial Differential Equations
中科院 4區 JCR Q4
大類:數學
-
Journal Of Mathematical Study
中科院 4區 JCR Q2
大類:數學
-

Discrete Analysis
中科院 3區 JCR Q1
大類:數學
-
Annals Of Pde
中科院 1區 JCR Q1
大類:數學
-

Houston Journal Of Mathematics
中科院 4區 JCR Q4
大類:數學
熱門期刊推薦
-
Journal Of Computational And Applied Mathematics
中科院 2區 JCR Q1
-
Electronic Journal Of Statistics
中科院 4區 JCR Q3
-
Mathematics
中科院 3區 JCR Q1
-
Journal Of Mathematical Analysis And Applications
中科院 3區 JCR Q1
-
Journal Of Nonlinear Science
中科院 2區 JCR Q1
-
Aims Mathematics
中科院 3區 JCR Q1
-
Numerical Methods For Partial Differential Equations
中科院 3區 JCR Q1
-
Journal Of Mathematical Study
中科院 4區 JCR Q2
